By Jimmy Twin, ISCRR Research Communications and Translation Manager.
I am not sure what is worse – the printed report gathering dust on the shelf, or the digital report forgotten in the digital void.
ISCRR research findings are typically showcased in a research report and vary quite a bit on length and content. However, the goal of each report is the same – for decision-makers to use our findings!
My previous blog article on research impact showed that ISCRR is doing pretty well in this regard; funding partners such as WorkSafe Victoria use our research to make evidence-informed decisions.
In this article, I am sharing some of the learnings that have helped our research to be used.
This goes without saying. Whether you are talking about dinosaurs or returning to work after injury, knowing what the research end users want and need is essential to delivering an impactful report. Tailor the report around their research questions and attempt to communicate according to their level of knowledge and expertise.
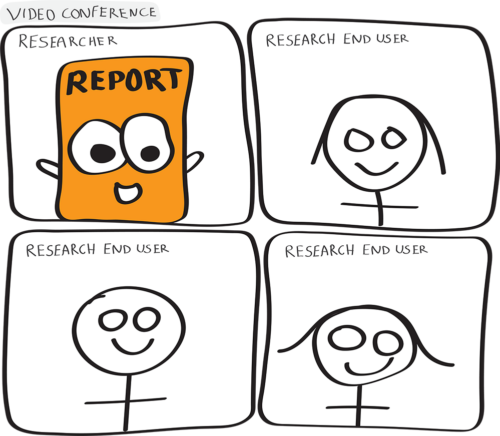
Before a draft research report is submitted, ISCRR’s research findings are routinely presented to key research end users. These ‘Emerging Findings’ presentations help us learn the level of detail required, and which learnings are of the most importance. Asking simple questions such as “how do you intend to use these findings?” gives an indication of the research impacts likely to be achieved.
It is a hard slog to read a 100-page research report. Even if it is a topic of interest.
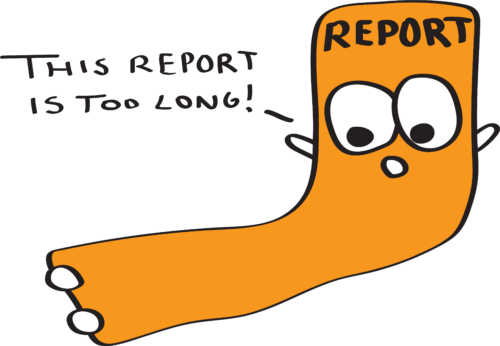
The best research reports I have read are succinct and avoid verbose introductions or discussions. Do not be afraid to be creative with how to display your research findings. Yes, tables are important. And so are graphs. I am not going to argue for you not to include them. But consider infographics and illustrations where appropriate, and move those lengthy tables to the end of the report (or better yet, as a separate supplemental document).
Include short explanatory summaries for complicated tables, graphs and statistics. And do not feel you need to follow the formulaic Introduction>Methods>Results>Discussion format – showcase your exciting results up front and state why they are important, then detail how the results were gained. You are telling a story. Keep that in mind when you are developing your narrative.
Adopt an elevator pitch approach to communicate your research findings. People are busy and most will not read your entire report. Particularly those who make those important decision-making impacts! Visual aids help immensely here. When anyone asks me how long an Executive Summary should be, I always reply “one page”. While that is not always achievable, try to make this the goal.
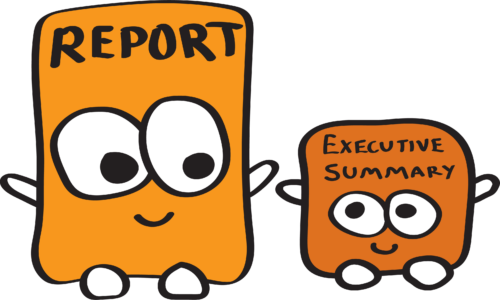
One of the biggest struggles I have seen researchers face is the perceived need to include all results in the Executive Summary. This summary should simply explain how the research has addressed the research aims and questions, and the implications of the findings. A good Executive Summary will make the reader wish to read more and give sufficient knowledge of what the report found. Conversely, avoid ‘spoiler-free previews’ – the Executive Summary should be able to stand alone.
While you may know the audience you are addressing, you will not necessarily know of any accessibility requirements. How does the report look printed and viewed on screen? Be mindful in the use of colours in your diagrams and the size of your font. Include ‘Alt Text’ for all images for those who cannot view the image. It is good practice and a great habit to form to discuss accessibility requirements with research end users.

The easiest way to know if your reports are hitting the mark is to ask. Obtain feedback from key research end users on how your reports were received and used. By adopting a continual improvement process, you will not only improve the quality of your reports, but this increased engagement may lead to new research opportunities!

My final piece of advice: talk to those who use your research, about how it will be disseminated, and to whom. That statistics heavy report may be perfect to one group who are familiar with interpreting such data, but is it the best format to send to busy executives?
At ISCRR, we develop tailored translation products to help our research reach the right people in the best format. We often develop short two to three-page research summaries of our reports, and in some cases develop infographic summaries and fact sheets. Developing extra resources may seem like an additional burden, but they are worth the time investment.

This article was written by Jimmy Twin, ISCRR Research Communications and Translation Manager. If you’ve found this article useful, please let us know via social media: Twitter or LinkedIn
On April 7, 2022 at 12pm AEST, Jimmy will be speaking about Translating research to achieve impact at our monthly ISCRR Learning Series webinar. Register here to attend this free webinar.